The actuarial view on developments COVID-19
Explaining and predicting hospitalization and death
Melchior Mattens MSc AAG
melchior.mattens@arcturus.nl
Could actuarial practice be relevant to epidemiology? There appear to be a surprising number of subjects within the epidemiological situation that affect this practice. The daily RIVM figures on Covid-19 touch on actuarial topics such as IBNR, GLM pricing models, seasonal patterns (time series) and forecasting. By applying actuarial models to this data, insight can be provided into developments in hospital admissions and mortality. These models can also be used to predict future developments and to quantify the uncertainty. The predictive power of the (combined) models can be tested every day. In the article ‘The actuarial view on developments COVID-19’ we show how these models can be combined into robust forecasting models..

Melchior Mattens MSc AAG
melchior.mattens@arcturus.nl
SARS-CoV-2, also known as Covid-19 and Coronavirus, has dominated daily life in the Netherlands and far beyond for some time. The cabinet is assisted in policy choices by the RIVM. In order to fulfill this role as effectively as possible, RIVM collects large amounts of data from hospitals and the GGD in order to gain insight into the spread rate of the corona virus, but also into the development in hospital admissions and mortality. Relevant cross-sections of these data are made available to the public by the RIVM on a daily basis. This includes the number of hospital admissions and deaths by event day, as well as cross sections of patient characteristics.
In this article, we will discuss the type of data that RIVM publishes about the Netherlands and how it should be interpreted. Could actuarial practice be relevant to epidemiology? There appear to be a surprising number of topics within the epidemiological situation which look like this practice: IBNR, time series and forecasting models are just a few examples. In this article, we look at the best available actuarial and econometric models for making a mortality prediction.
Incurred But Not Reported (IBNR)
As mentioned, RIVM publishes the number of admissions and deaths by event day on a daily basis, and adjusts the number of reports from previous event days. Healthcare institutions usually have a reporting delay when someone with a positive Covid-19 test has been admitted or has died. This creates a reporting pattern in the number of admissions and deaths: only after about seven days do we know approximately how many people were actually admitted and died at a specific day. The number of deaths reported in the media daily is the sum of all newly reported deaths since the outbreak in the Netherlands and not just from the previous day.
The actuarial profession is very familiar with the problem that it is not yet exactly clear how many people have been admitted or died. Ideally, one has insight into the actual number of patients admitted and dying today: then trends become visible more quickly and more clearly.
Because we can follow the development for each event date through time, so-called triangular overviews are created of the number of patient admissions and deaths by event day and reporting day. These are shown in the figures below. The problem is that for the most recent days there can still be a lot of development of delayed reports on the number of admissions and deaths. However, the actuarial profession knows what to do with such overviews. A Chain Ladder model can be applied to estimate the total number of admissions and deaths per day. This applies the average run-off pattern from previous days to the numbers already reported at this time.
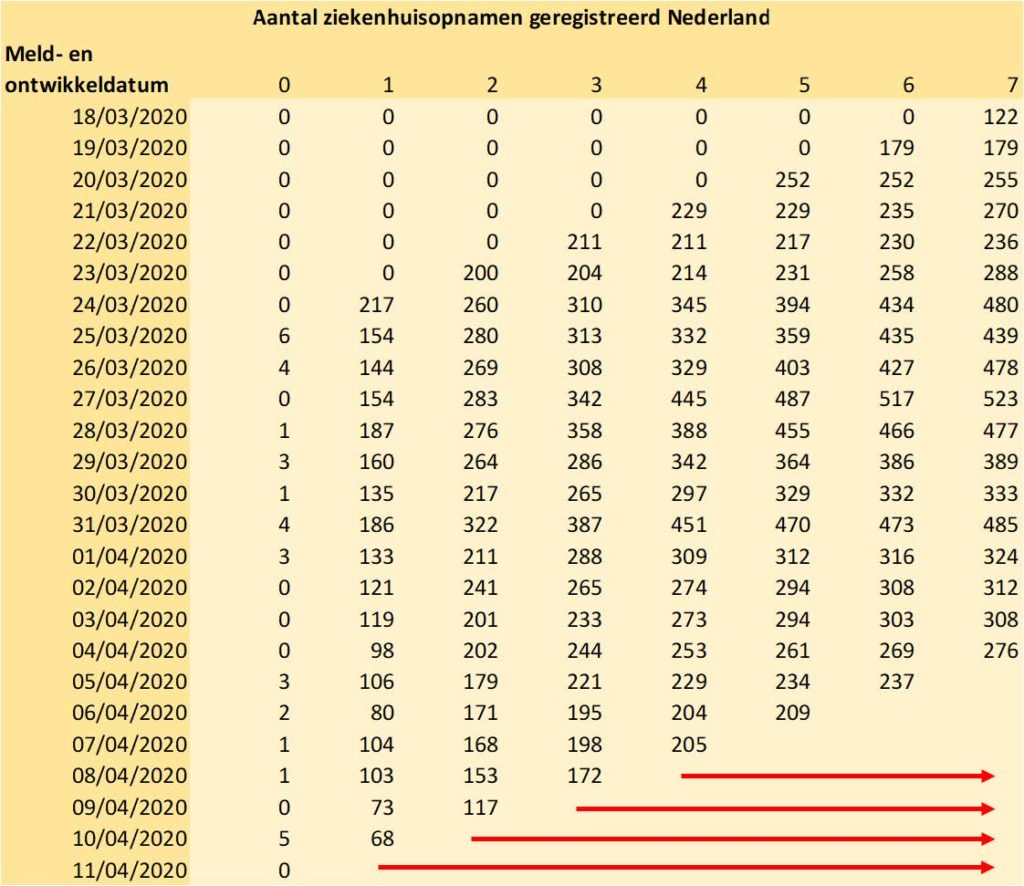
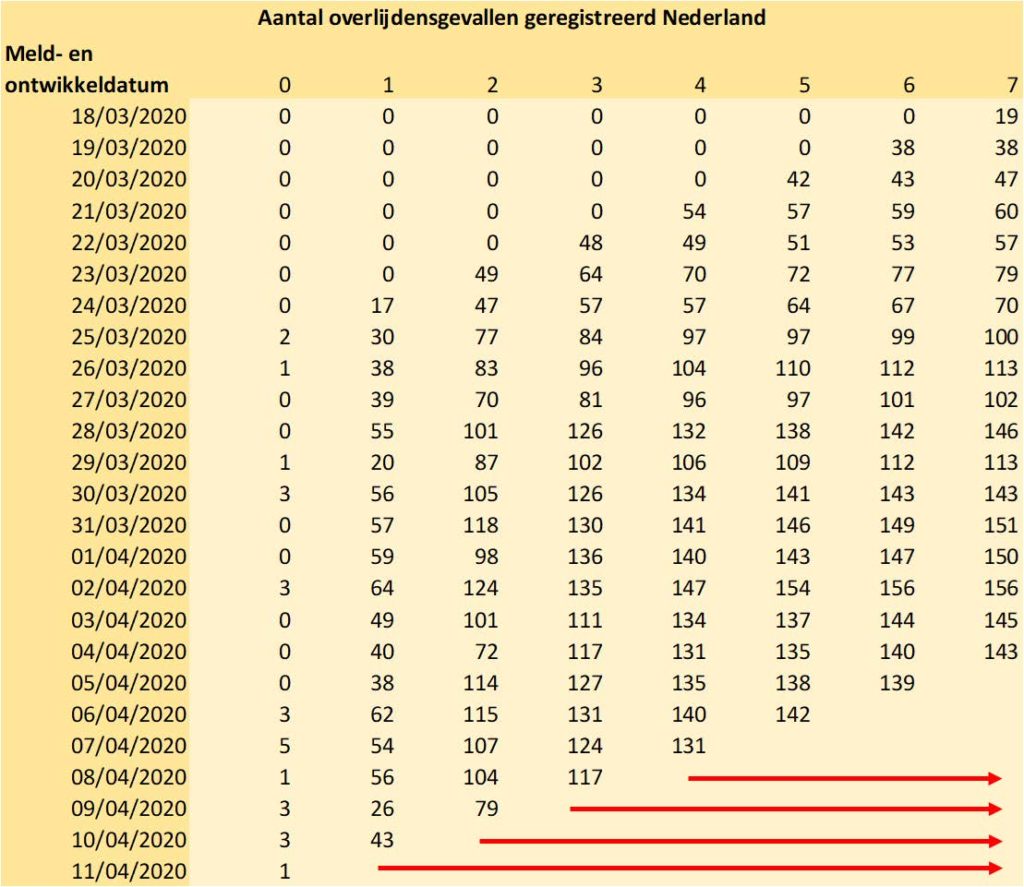
Figures 1 and 2: triangular overviews of admissions and fatalities in the Netherlands. The estimate of the final number is shown with the red arrows.
What is striking about the tables above is that for the last two days there is enormous uncertainty about the actual admissions and deaths. As with many (non-life) insurance policies, an alternative estimation method is needed for this. For example, by looking at the development in the total number of admissions / deaths (ultimate). Using statistical software, the following time series model (ARIMA) can be fitted that provides a projection for the number of hospital admissions and the 95% prediction interval surrounding it.
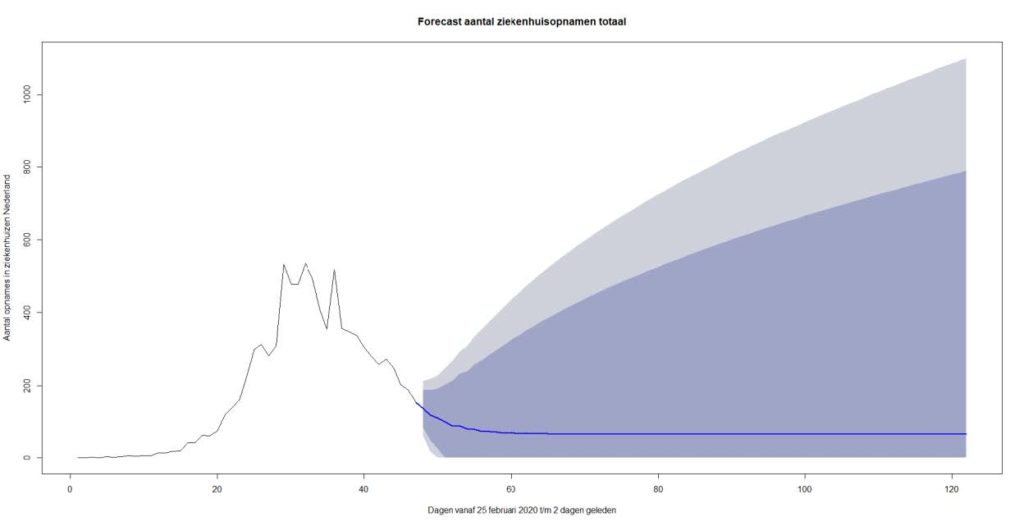
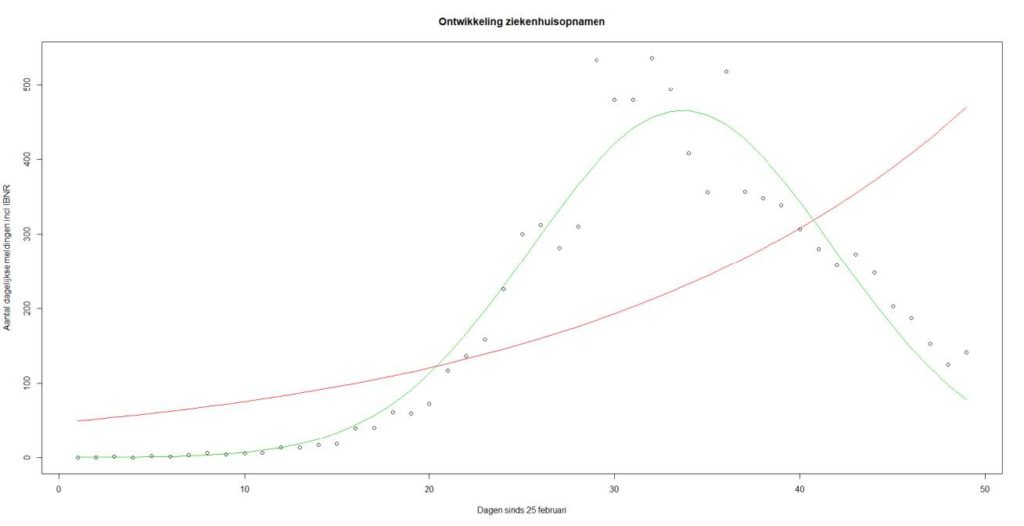
Figure 3: ARIMA model for daily number of hospital admissions in the Netherlands. Forecast up to 75 days ahead. Prediction interval: 75% and 90% probability.
Figure 3 shows that until around April 1st , an exponential relationship was observable in the number of daily hospital admissions including IBNR. Figure 4 zooms in on the period up to and including 13-4-2020. The dots indicate the number of admissions including IBNR and two curves have been added trying to fit a possible time relationship in the data. The red curve is the exponential best fit on the data and the green curve is the density function of a normal distribution. We see that the green curve fits much better and the decrease in the number of admissions has clearly started.
To predict the number of deaths this method is, however, too simplistic. After all, this is based on all kinds of risk factors, such as age and any comorbidities.
Mortality development and modeling
In addition to hospital admissions and deaths, RIVM publishes daily overviews of the registered patient group by age, gender and underlying conditions (comorbidities). In the plots below, the development of the share in the (hospital) patient population and the status of the observed mortality frequency are represented for a number of important age groups and gender.
Figure 5
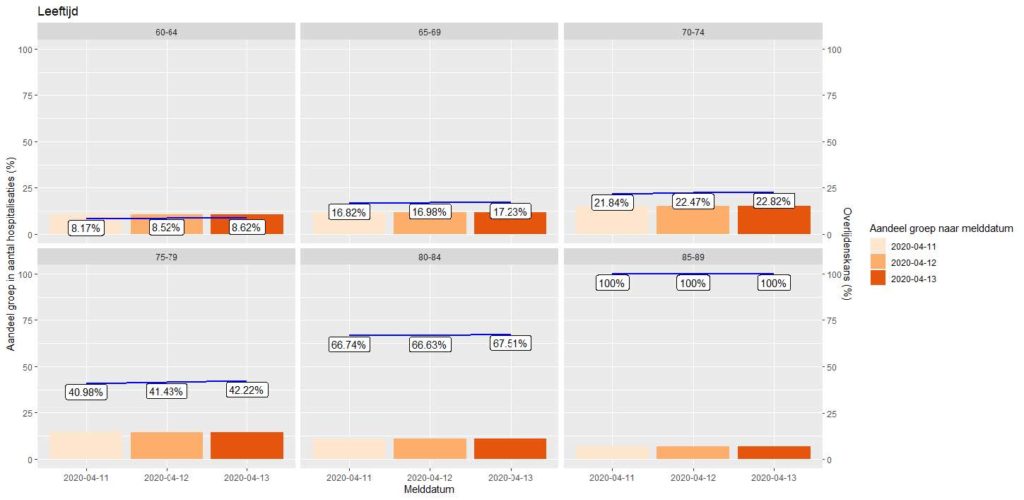
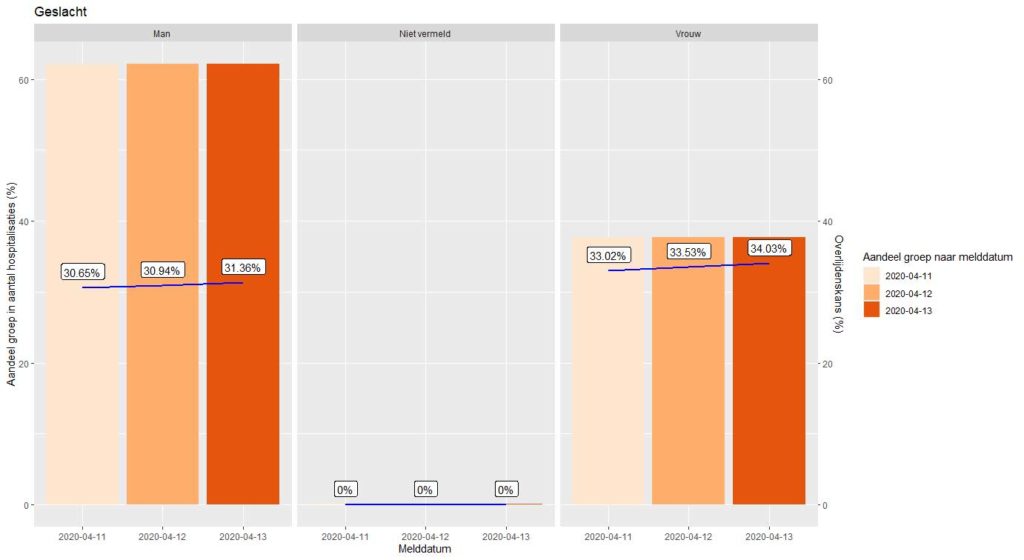
Figures 5 and 6: development in the share of hospital admissions per group (bars) and development in total mortality risk (labels and line).
These plots provide insight (into fluctuations) in the mortality probability within a risk group. To predict future mortality, these data must be viewed on an incremental basis: can the daily mortality be explained by the number of hospital admissions from X number of days earlier?
In order to be able to make an optimal prediction model for future mortality, we would like to combine information on important risk factors from the admitted patients: for example, does it make a difference whether someone has underlying suffering at a younger age and do older men have a lower chance of survival than older women? To provide insight, these risk categories should be available per patient. Unfortunately, RIVM only publishes tables without relationship between gender, age and comorbidities: we can only make models on the three separate series.
Since we can only predict mortality with these three risk factors as separate explanatory variables, the question is what the impact of a split might be. Statistics Netherlands’ Statline provides information about the Dutch population as a whole. Here you will find data on age, gender and syndromes. On the one hand, there are more women in the older age groups (risk factor), but on the other hand it is known that cardiovascular diseases, hypertension, diabetes1 and lung diseases are more common for men than for women. Since this selection of comorbidities is highly relevant in terms of mortality, we see that the gender ratio strongly correlates with comorbidities. We also note that the incidence of comorbidities is strongly correlated with age. If we combined data for the three risk factors, there was a high probability of autocorrelation. Fitting three separate models prevents autocorrelation and estimation differences may indicate that certain trends may or may not be better captured by one or more models.
To arrive at a mortality forecast for the two most recent days and one day ahead, we optimize GLM models from the quasi Poisson family. Generalized Linear Models (GLM) are frequently used in the actuarial profession to quantify risk factors. The explanatory variables in the model capture the effect of the mean hospital stay of a patient in a certain risk class on the probability of dying X days later. With these models we can make a fairly accurate prediction of mortality a few days ahead. Because we also have to make a forecast of the two most recent days that cannot be projected with Chain Ladder, we initially project the mortality for three days in advance. By adding the extra day (the third day ahead) an entire diagonal can be built up in the Chain Ladder model with the next day’s position. The estimates for mortality as of 13-4-2020 are shown in the table and graph below.
| Date | Date of death age model | Mortality Comorb. Model | Mortality Gender model | Average mortality 3 models |
| 12/04/2020 | 73 | 84 | 87 | 81 |
| 13/04/2020 | 49 | 142 | 77 | 89 |
| 14/04/2020 | 91 | 80 | 55 | 75 |
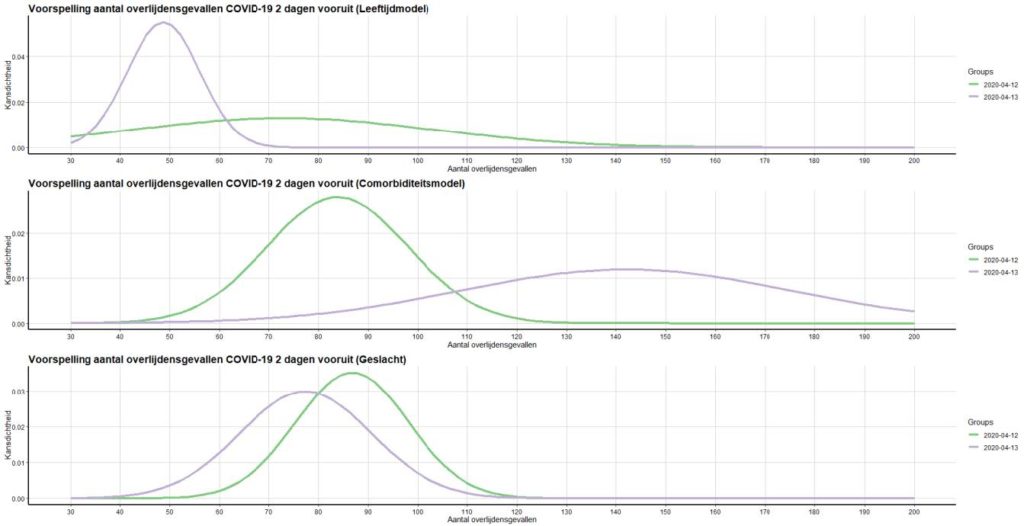
Figures 7 and 8: Mortality prediction by model, including estimated bandwidth.
By averaging the model results, a weighed picture of the total number of deaths in the past days is obtained. With this full estimate for the two most recent days based on the average model results, the pattern of the Chain Ladder model for the two most recent days can be scaled-up. Subsequently, the development in daily mortality (ultimates) can also be displayed. An attempt was made to capture the trend in the data using various “best fitting” functions.
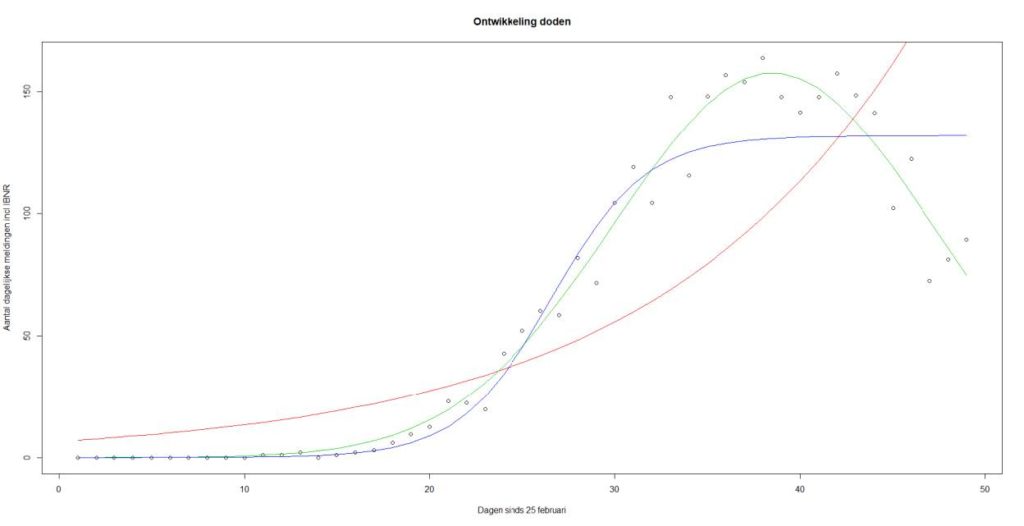
Figure 9: Development of mortality by event day. Red line: exponential relationship, blue line: sigmoid function, green line: Gaussian curve (normal distribution).
The above figure shows a clear downward trend for the number of deaths in the recent week. This is a slightly delayed image that is also visible in Figures 3 and 4 for the number of hospital admissions. The green line (the Gaussian curve) seems to best capture the trend in mortality. We cannot build entirely on an extrapolation of this curve for a mortality forecast. After all, the models recognize that it is very relevant whether there is an influx of new hospital patients and in which risk groups they fall (on average).
Prediction of mortality report RIVM
The RIVM reports daily deaths on reporting day (all deaths reported between 10:01 am the previous day and 10:00 am on the current day). This corresponds to the incremental development on the first future diagonal predicted by the Chain Ladder model. This concerns the prediction of the diagonal as shown in the figure below.
By determining the incremental development between the last reading and the predicted position for the next day (gray diagonal), a prediction for the mortality to be reported by RIVM can be derived. For 14-4-2020, this prediction comes out at 89 deaths.
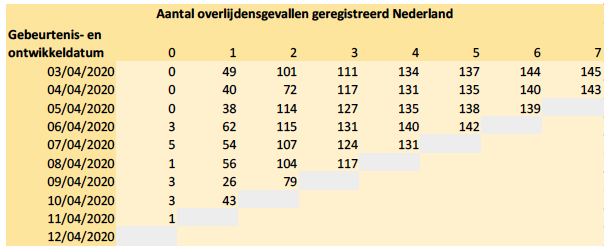
Figure 10: Triangle number of deaths by event and development date.
Forecast
The forecast of further mortality development highly depends on the eventual number of new hospital admissions and the proportions of the number of patients with certain ages and comorbidities. Also, mortality itself still has a stochastic component. The mortality models assume a (quasi) Poisson distribution. For the development in relative proportions of patients per age group and the total number of patients (Figure 3), ARIMA models are used and prediction intervals are derived from them. With the linkage of the mortality models for age groups to the prediction models for the total number of daily hospital admissions (including IBNR) and the relative proportions of the influx by age groups, the mortality in figure 11 is projected 75 days ahead. This projection is shown below on a cumulative basis.
The forecast shown in Figure 11 has a wide prediction interval. The ARIMA model for the inflow of new patients expects a stabilizing low inflow in the near future. However, there is a considerable possibility that the influx will (almost) reduce to zero, so that after a few weeks the mortality will also drop to (almost) zero. This provides an indication of the lower limit for future deaths due to Covid-19.
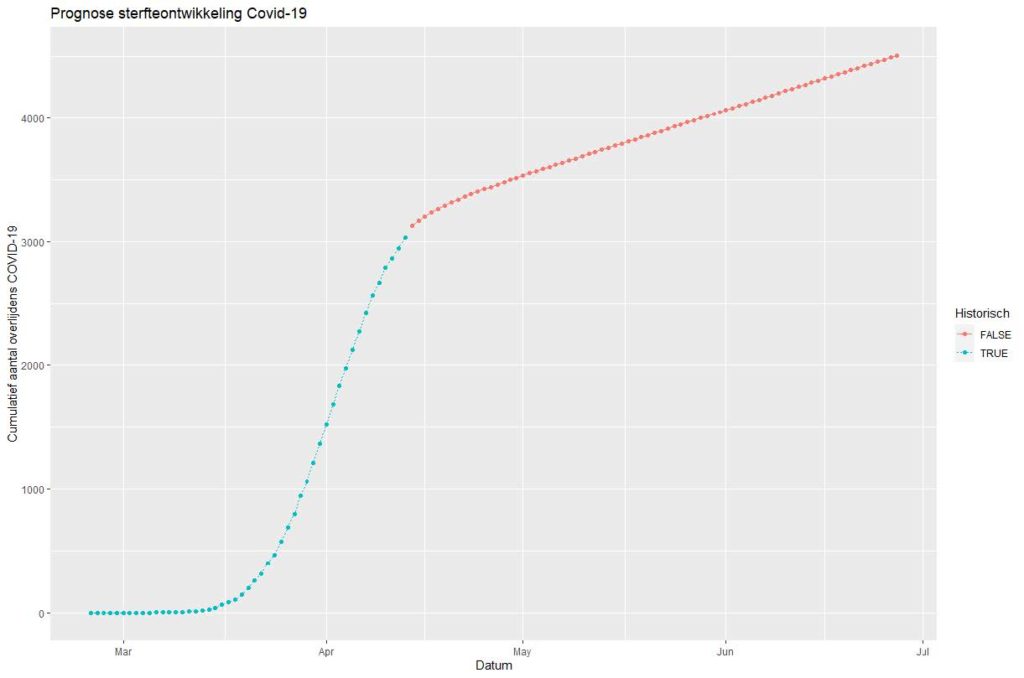
Figure 11: Cumulative mortality and mortality forecast, 75 days ahead. Model based on expected inflow of new patients in age cohorts. Blue: Historical Cumulative Development. Red: predicted future development.
A limitation in these predictions is that they assume unchanged circumstances. These results will have to be adjusted in the event of policy changes, such as more testing or removal of restrictions in society. 9
At the same time, observations by Statistics Netherlands show that the RIVM data probably underestimated the national excess mortality as a result of Covid-19. The projection model described in this article does not capture this missing mortality either. The deaths missing in the RIVM data mainly concern deaths at home or in care institutions where people could not be tested for Covid-19. Therefore, the model results should be seen as only indicative: the number of hospital admissions is likely to be (strongly) correlated with the number of unregistered deaths. This is true in the case that within an age and / or comorbidity group, people are just as likely to recover or die quickly or be ill long enough to be hospitalized. At the moment, at least there is no scientific literature that rejects this assumption.
Actuarial models
All the models mentioned in this article are prediction models widely used in the actuarial profession. The RIVM figures on Covid-19 touch on actuarial topics such as IBNR, GLM pricing models, seasonal patterns (time series) and forecasting. The predictive power of the (combined) models can be tested daily. Back testing and sensitivity analysis are important to provide a robust estimate for the future impact of Covid-19 on Dutch society. As still many developments are expected (for example the reversal of a number of quarantine measures) which may affect the spread of Covid-19, it will be necessary to continuously monitor the development of the hospital admissions and mortality. We are happy to accept the challenge to further develop the actuarial models and to update you on the insights these models provide.